Cornwall House Prices Remain Far Below Ontario and Canada
September 25, 2023Cornwall Ontario – The cost of owning a home in Cornwall remains far below provincial and national averages.
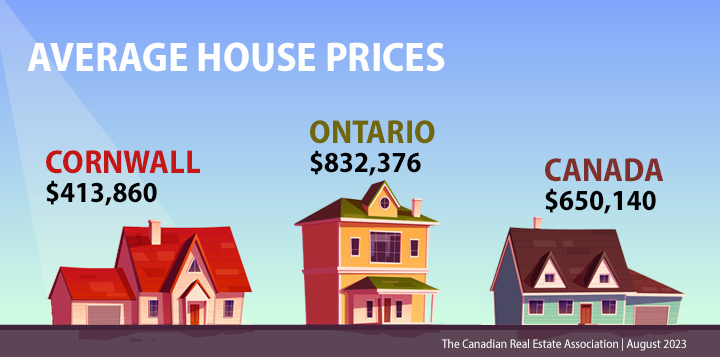
The average price of homes sold in Cornwall in August 2023 was $413,860, which is half of Ontario’s average sale price ($832,376) and significantly lower than Canada ($650,140). The Cornwall sale price decreased by 5.2% from August 2022.
“Sales activity jumped from year-ago levels in August, rising to just below typical levels for this time of year,” said Vicki Vanderveen, President of the Cornwall and District Real Estate Board. “The rise in sales was accompanied by a surge in new listings, which fueled buyer activity and brought the market back down into balanced territory. Overall inventories are still very low by historical standards but appear to have stabilized, while price levels remain historically elevated but are gradually coming down from the highs of 2022.”
Additional stats from the Cornwall and District Real Estate Board provide further insights:
- The more comprehensive year-to-date average price in Cornwall and district was $425,672, a decline of 4.6% from the first eight months of 2022.
- The number of homes sold through the MLS® system totaled 126 units in August 2023. This was an increase of 24.8% from August 2022.
- Home sales were 8% below the five-year average and 3.9% below the 10-year average for the month of August.
- On a year-to-date basis, home sales totaled 791 units over the first eight months of the year. This was a large decline of 14.7% from the same period in 2022.
- The dollar value of all home sales in August 2023 was $52.1 million, up by 18.2% from the same month in 2022.
- The number of new listings saw a substantial increase of 37.4% from August 2022. There were 191 new residential listings in August 2023. This was the largest number of new listings added in the month of August in more than five years.
- New listings were 16.3% above the five-year average and 3.9% above the 10-year average for the month of August.
- Active residential listings numbered 306 units on the market at the end of August, a sizable gain of 15% from the end of August 2022.
- Active listings were 10.2% above the five-year average and 42.2% below the 10-year average for the month of August.
- Months of inventory numbered 2.4 at the end of August 2023, down from the 2.6 months recorded at the end of August 2022 and below the long-run average of 4.2 months for this time of year. The number of months of inventory is the number of months it would take to sell current inventories at the current rate of sales activity.
Average Housing Prices and Apartment Rentals
Cornwall is an affordable place to live – whether you are renting or looking own your own home. The following two links provide additional information on average housing prices and apartment rental rates in Cornwall. Click on the following link to see the most recent numbers:
About the Cornwall and District Real Estate Board
The Cornwall and District Real Estate Board covers a large area, including the City of Cornwall and the Counties of Stormont, Glengarry, Prescott, and part of Dundas. It is uniquely situated next to the Quebec and U.S.A. borders, with the scenic St. Lawrence River running along the south and the Ottawa River along the north. Some of Canada`s most productive farmland blankets the region`s countryside, framing thriving villages, towns and cities. The Cornwall and District Real Estate Board currently has 190 members.
Click on the following link for more info: